NetCDF4 데이터 가시화(2)
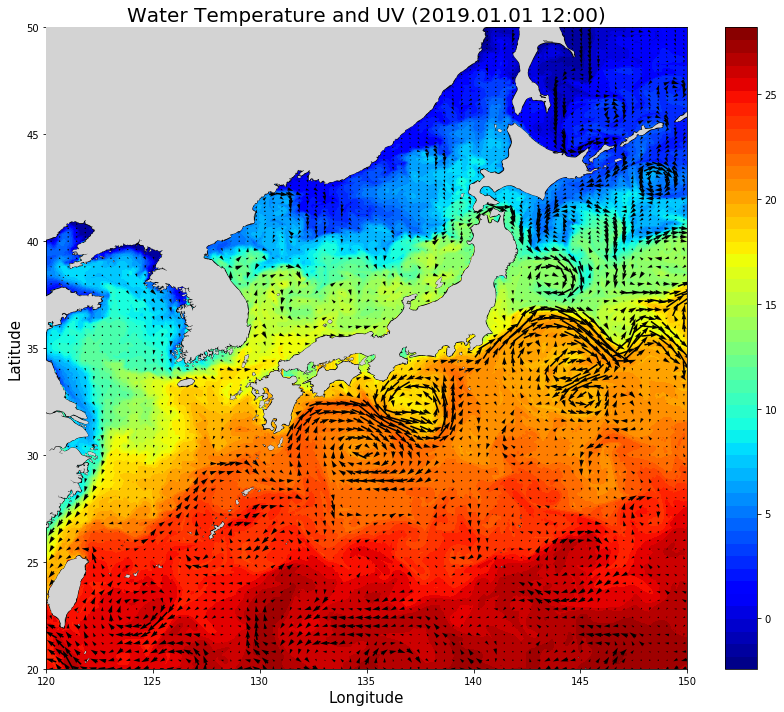
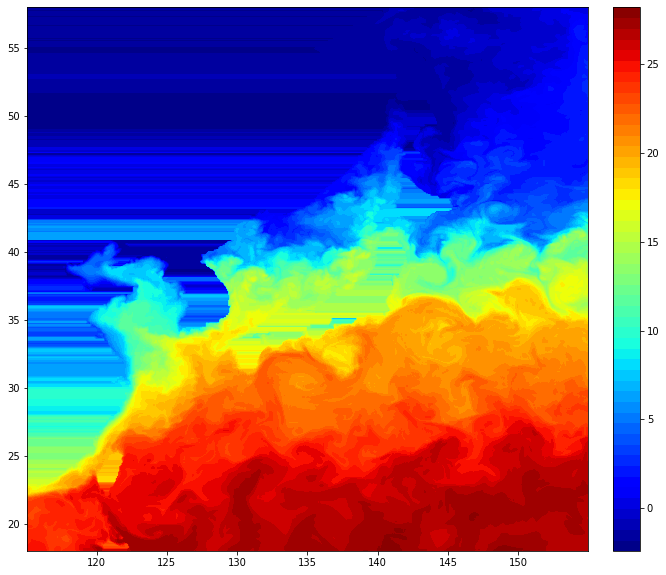
1편에 이어서 NetCDF4 데이터를 읽어서 다음과 같이 가시화해보겠다.

2편에서는 Basemap이라는 라이브러리를 사용하여 해안선을 깔아줄 것이다.
이를 위해서 먼저 Basemap을 설치해주자.
Basemap 설치
Basemap은 지도 데이터를 담은 파이썬 라이브러리이다.
CMD에 다음의 명령어로 라이브러리를 설치해준다.
conda 대신 pip를 사용해도 된다.
conda install -y -c conda-forge basemap geos proj4 basemap-data-hires
지도 추가
이제 여기에 지도를 추가해줄 것이다.
다음과 같은 코드를 추가하자
from mpl_toolkits.basemap import Basemap
m = Basemap(projection='cyl',llcrnrlat=20,urcrnrlat=55,\
            llcrnrlon=120,urcrnrlon=150,resolution='l')
m.drawcoastlines()
m.fillcontinents(color='lightgray')

강이나 호수 제거
그런데 러시아쪽에 강이나 호수가 보이는데, 이게 꽤나 거슬린다. 어떻게 하면 지울 수 있을까 하다 다음과 같은 글을 보았다.
If you want to stick with Basemap, get a shapefile which doesnt contain the rivers. Natural Earth for example has a nice ‘Land’ shapefile in the physical section (download ‘scale rank’ data and uncompress). See http://www.naturalearthdata.com/downloads/10m-physical-vectors/
(링크 https://stackoverflow.com/questions/14280312/world-map-without-rivers-with-matplotlib-basemap)
요약하자면, Basemap은 쓰고 싶은데 강은 보기 싫으면 위의 링크로 들어가 ‘Land’ shapefile을 다운받으라고 한다. 위의 링크에 들어가면 Land가 보이는데, 위의 글 처럼 scale rank를 다운받지 말고 land를 다운받도록 하자. 다운받았으면 코드 위치에 넣고, 다음과 같은 코드를 추가해준다.
from matplotlib.collections import PathCollection
from matplotlib.path import Path
shp_info = m.readshapefile('10m/ne_10m_land', 'scalerank')

paths = []
for line in shp_info[4]._paths:
    paths.append(Path(line.vertices, codes=line.codes))
coll = PathCollection(paths, linewidths=0, \
                     facecolors='lightgrey', zorder=100)

ax.add_collection(coll)
shp_info = m.readshapefile('10m/ne_10m_land', 'scalerank')의 파일 경로부분에 자신이 다운로드한 10m land 데이터의 위치를 적으면 되겠다.
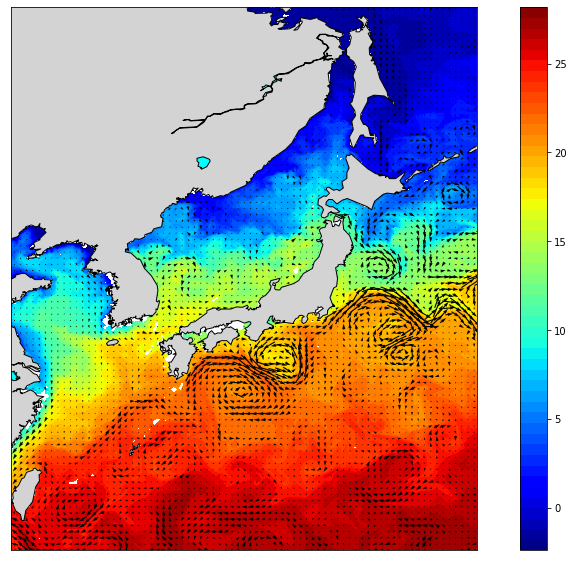
위의 코드를 한 곳에 모아두면 다음과 같은 결과물이 나온다.

내삽 및 외삽(Interpolation & Extrapolation)
사용한 NetCDF4 데이터가 Basemap의 육지 데이터와 완벽하게 맞아떨어지지 않아서 중간중간에 흰색 빈 칸이 있는 것을 알 수 있다. 이를 지우고자 한다면 내삽(Intrapolation)과 외삽(Extrapolation)을 해줘야 할텐데, 내삽과 외삽이 필요한 영역이 워낙 작고 바로 옆의 값은 크게 차이나지 않을테니까 nearest neighbor방법을 사용하겠다.
Pandas라는 모듈에 내삽과 외삽을 해주는 함수가 있다.
이후 Pandas에 대해 자세히 다루겠다만, Pandas는 오픈소스 데이터 분석 및 조작 도구이다.
데이터베이스 상에 값이 없는 일은 흔하며, 이를 채우기 위해 fillna라는 함수를 제공한다.
수온 데이터를 가시화 하기 전에 다음과 같은 코드를 추가해주자.
## Interpolation & Extrapolation
import pandas as pd
df = pd.DataFrame(water_temp)
print(df)
df = df.fillna(method='ffill', axis=1)
df = df.fillna(method='bfill', axis=1)
water_temp = df.values
위의 코드는 water_temp를 표 형식의 데이터베이스(pd.DataFrame)으로 바꿔주고, 각 열별로 빈 값을 채워준다.
ffill은 데이터가 없을 때 앞에 나온 데이터를 그대로 붙여넣고, bfill은 데이터가 없을 때 뒤에 나온 데이터를 그대로 붙여넣는다.
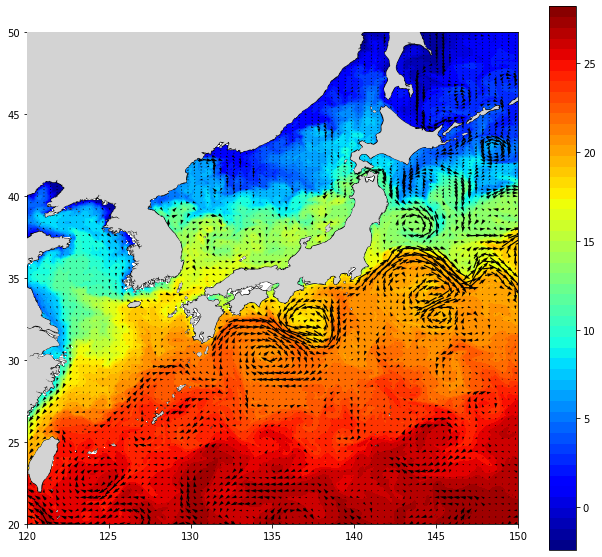
이후에 water_temp만을 출력해보면 다음과 같이 빈 칸이 매워진 그림을 볼 수 있다.

전체 코드
import matplotlib.pyplot as plt
from netCDF4 import Dataset
import numpy as np

nc_data = Dataset("hycom_glbv_930_2019010112_t000_ts3z_r.nc",\
                  "r", format="NETCDF4")
nc_data2 = Dataset("hycom_glbv_930_2019010112_t000_uv3z_r.nc",\
                  "r", format="NETCDF4")

depth = nc_data['depth'][:]
lon = nc_data['lon'][:]
lat = nc_data['lat'][:]

water_temp = nc_data['water_temp'][:]
sal = nc_data['salinity'][:]
water_u = nc_data2['water_u'][:]
water_v = nc_data2['water_v'][:]

water_temp = water_temp[0,0]
water_u = water_u[0,0]
water_v = water_v[0,0]

lon, lat = np.meshgrid(lon, lat)

fig, ax = plt.subplots(1, 1, figsize=(11,10))
fig.patch.set_facecolor('w')

## 외삽 및 내삽
import pandas as pd
df = pd.DataFrame(water_temp)
print(df)
df = df.fillna(method='ffill', axis=1)
df = df.fillna(method='bfill', axis=1)
water_temp = df.values

# 수온 가시화
water_temp_plot = ax.contourf(lon, lat, water_temp,\
                             levels=50, cmap='jet')
fig.colorbar(water_temp_plot, ticks=list(range(0,31,5)),
            fraction=0.046, pad=0.04)

# 유속 가시화
step = 5
ax.quiver(lon[::step,::step], lat[::step,::step],
           water_u[::step,::step], water_v[::step,::step],
           pivot='mid', scale=40, )

# Basemap을 사용한 지도
from mpl_toolkits.basemap import Basemap
m = Basemap(projection='cyl',llcrnrlat=20,urcrnrlat=55,\
            llcrnrlon=120,urcrnrlon=150,resolution='l')
m.drawcoastlines()
m.fillcontinents(color='lightgray',lake_color='aqua')

# 강, 호수 없애기
from matplotlib.collections import PathCollection
from matplotlib.path import Path
shp_info = m.readshapefile('10m/ne_10m_land', 'scalerank')
paths = []
for line in shp_info[4]._paths:
    paths.append(Path(line.vertices, codes=line.codes))
coll = PathCollection(paths, linewidths=0,\
                      facecolors='lightgrey', zorder=100)
ax.add_collection(coll)

# 제목, 라벨, 틱 등 설정
ax.set_xlim(120,150)
ax.set_ylim(20,50)
ax.set_xticks(range(120,151,5))
ax.set_yticks(range(20,51,5))
ax.set_xlabel('Longitude', fontsize=15)
ax.set_ylabel('Latitude', fontsize=15)
ax.set_title('Water Temperature and UV (2019.01.01 12:00)', fontsize=20)

plt.tight_layout()
plt.show()

